Stock market indices around the world are near
historic highs. During the past ten years, the FTSE 100 has almost
doubled, the DAX trebled, and the S&P500 quadrupled. Including
dividends, the returns are even higher. With uncertainty over trade
wars, Brexit, and other economic and political headwinds, how much could
asset prices fall? Can investors buying today still expect high returns
in the future?
History may give us some insights into these questions. For financial
economists, long-run stock market data can help to assess the equity
risk premium (Dimson et al. 2007, Goetzmann and Ibbotson 2007), market
efficiency and asset pricing (Le Bris et al. 2019, Mirowski 1987, Ito et
al. 2016), and asset bubbles (Shiller 1989, 2000, Frehen et al. 2013).
The challenge for researchers is the availability of high quality
long-run stock market data. For the US, the Centre for Research in
Security Prices dataset from 1926 onward is the standard
source. Prior to this date, Goetzmann et al. (2001) have
constructed an index back to 1815, while other spliced indices reach
back to 1800 (Cowles 1939, Smith and Cole 1935).
Dimson et al. (2002) constructed an annual index for the UK beginning
in 1900. However, the preceding Victorian era is also very
interesting, as during this period the UK led the world in terms of
technology, political influence, and financial development. In a recent
paper (Campbell et al. 2019),
we analyse market performance during this time, by constructing new
long-run broad-based indices of equities traded on British securities
markets for the period 1829-1929.
Data
The data used to calculate these indices constitute the largest, most
comprehensive monthly database ever compiled on British share markets
during the century prior to the onset of the Great Depression. We use
the Course of the Exchange and the Investor’s Monthly Manual to collect more than one million security-month observations on over 5,800 securities representing about 4,500 companies.
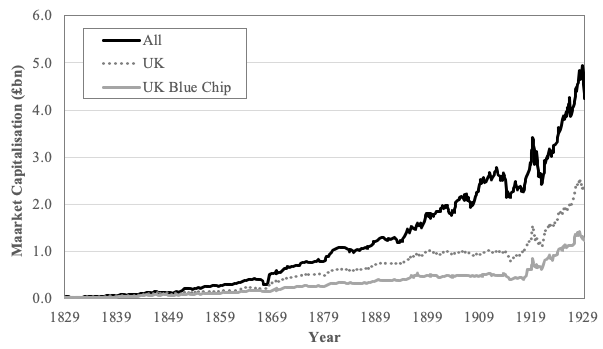
The data show that the UK share market grew rapidly during the period
under consideration and became increasingly international in scope
(Figure 1). For the first 50 years of the sample period, transportation
(first canals, then railways) and finance dominated the equity market.
This dominance diminished after the 1870s, but these two broad sectors
still constituted about 40% of market capitalisation of the sample in
1929. The development of new industries as well as flotations
of established private firms in sectors such as brewing, iron, coal,
and steel explain much of the growth of the share market between 1879
and 1929.
Figure 1 Total market capitalisation of common shares in the sample, 1829-1929
Price indices, 1829-1929
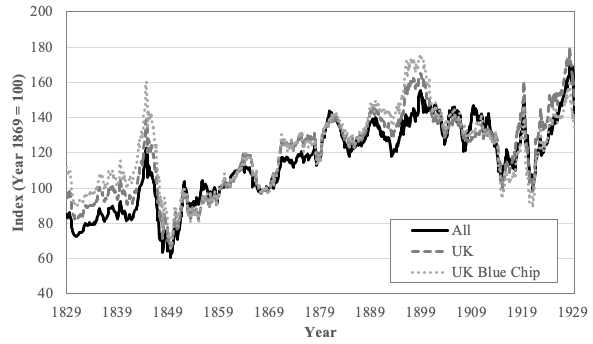
We construct three indices of capital appreciation each weighted by
market capitalisation, from 1829 to 1929: an all-share index; a UK-share
index, which is composed solely of domestic firms; and a blue-chip
index, which consists of the largest 30 domestic stocks in each year.
Figure 2 reveals several substantial fluctuations in these price
indices. The largest percentage decline in the UK index occurred during
1845-1850, following the collapse of the Railway Mania, when the index
fell by 53%. Large declines occurred during the post-World War I slump
(39%), during the early stages of the Great Depression in 1929 (18%),
and following the crashes associated with Overend Gurney in 1866 (19%),
the City of Glasgow Bank in 1878 (11%), and the Baring crisis in 1890
(12%). The most dramatic market advances took place during the 1842 to
mid-1845 Railway Mania (52%), from 1915 to 1920 (61%), and during the
seven years prior to the 1929 crash (84%).
Figure 2 Capital gains indices, 1829-1929
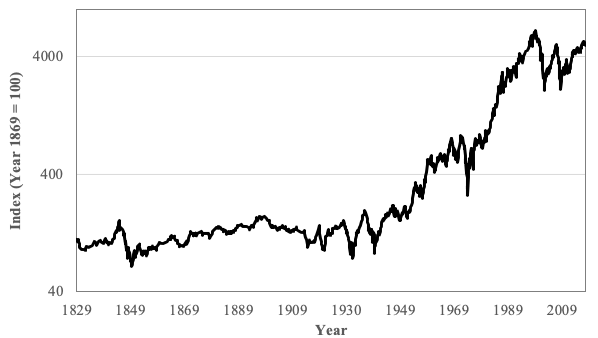
The blue-chip index, 1829-2018
The Investor’s Monthly Manual ceased as a publication in
1930 and our indices therefore stop at this point. However, another
index known as the FT30 runs from that era to the current day. The FT30
is not ideal, as it uses the geometric average of each company’s return
to calculate the return of the index, but it is highly correlated with
other indices such as the FTSE100. We splice our end-of-month blue-chip
index on to the end-of-month values of the FT30, to create a monthly
blue-chip index for the UK stock market from 1829 to 2018, shown in
Figure 3.
Figure 3 Monthly blue-chip capital gains index, 1829-2018
By 1940, the blue-chip index had fallen to below where it stood in
1829, but then began an upward trajectory that persisted until 1999.
This 60-year-period witnessed a nearly 80-fold increase in the blue-chip
index. This pattern is similar to Goetzmann et al.’s (2001) findings
for the US. Three things may account for this performance. First,
companies in the modern era have paid out smaller dividends and
investors have received more of their returns via capital gains
(Grossman and Shore 2006). Second, the demise of the gold standard and
then the Bretton Woods arrangement resulted in much higher inflation in
the post-1940 world, which translates into higher nominal returns.
Third, companies, and therefore their equities, simply performed better
in the six decades after 1940.
There have been at least seven sharp contractions in the stock market
from 1829 to 2018 according to the blue-chip index: 1845-1849, 1920-21,
1929-1932, 1937-1940, 1972-1974, 2000-2002, and 2008-2009. All the
contractions have been associated with major economic downturns, except
for those of 1845-49 and 2000-02, which were associated with the ends of
new technology booms on the stock market, i.e. railways and the
internet.
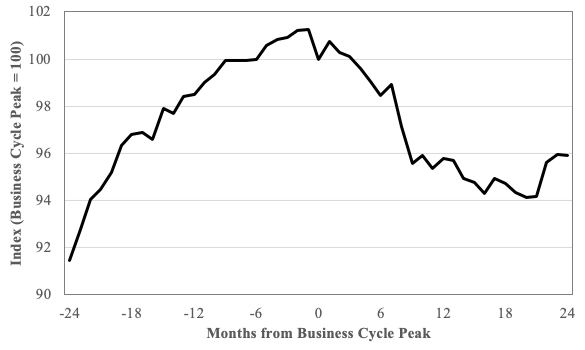
Can we use these stock market indices to understand British
macroeconomic fluctuations over the long run? We use Chadha et al.’s
(2000) catalogue of business cycle peaks and troughs from 1857 to 1954,
and the OECD indicators on reference turning points from 1955 to
2018. We construct business cycle diagrams in the style of
Burns and Mitchell (1946). For each of the business cycles, we rebase
the blue-chip index to be 100 at the cycle peak and then focus on the
four-year period around this point. We then take the average value of
the rebased index each month across all of the business cycles (Figure
4).
Figure 4 Blue-chip index performance over the business cycle, 1857-2018
The capital gains index of blue-chip companies appears to be a good
bellwether of macroeconomic behaviour. During the two years prior to the
business cycle peak, the index increases by an average of 10.7%. The
index peaks one month before the peak of the business cycle, and then
declines steadily thereafter. The index bottoms out 20 months following
the cyclical peak, losing an average of about 7.0% from its peak value.
Equity premium
Although capital gains are a useful measure of share price
fluctuations, investors are most interested in total returns, that is,
capital gains plus dividends. The total return for the 100-year period
between 1829 and 1929 averaged 5.4% per year for all equities, 5.3% for
UK equities, and 4.9% for the blue-chip UK equities, with almost all of
this coming from dividends.
Inflation during this period averaged just under 0.4% per year, so
real returns would have been about 5.0%. The average return on prime
bills during this period was about 3.5%, so the equity premium was just
over 1.9%. These are quite modest compared to recent experience –
between 1968 and 2017, real returns were 6.4% and the equity premium
over bills was 4.8% (Dimson et al. 2018, p. 35).
The early decades of the sample period (i.e. the 1830s and 1840s)
have amongst the lowest capital gains, dividend yields, and total
returns. The early years of the modern share market, given their
frequent boom and busts, were not remunerative for investors. However,
investors that were still in the market during the 1850s enjoyed the
highest capital gains and total returns of any decade. Returns were
quite low around the start of the twentieth century, but the next two
decades had the largest dividend yield of any decade and slightly above
average total returns.
Further research
The results presented here should represent the most complete monthly
indices for 19th and early 20th century British share markets created
to date. The indices are included in our paper’s appendix and could be
useful in a wide range of contexts for future research in economic
history and financial economics.
References
Burns, A F and W C Mitchell (1946), Measuring business cycles, New York: National Bureau of Economic Research.
Campbell, G, R S Grossman and J D Turner (2019), “Before the cult of
equity: New monthly indices of the British share market, 1829-1929”,
CEPR discussion paper 13717.
Chadha, J S, N Janssen and C Nolan (2000), “An examination of UK
business cycle fluctuations: 1871-1997 - supplementary paper”, Cambridge
working papers in Economics 0024, Faculty of Economics, University of
Cambridge.
Cowles, A (1939), Common-stock indexes, Bloomington, IN: Principia Press.
Dimson, E, P Marsh and M Staunton (2007), “The worldwide equity premium: A smaller puzzle”, in Mehra, R (ed), Handbook of the equity risk premium, p. 467-514, Amsterdam: Elsevier.
Dimson, E, P Marsh and M Staunton (2018). Credit Suisse global investment returns yearbook 2018, Zurich: Credit Suisse Research Institute.
Frehen, R G P, W N Goetzmann and K G Rouwenhorst (2013), “New evidence on the first financial bubble”, Journal of Financial Economics 108(3): 585-607.
Goetzmann, W N, R G Ibbotson and L Peng (2001), “A new historical
database for the NYSE 1815 to 1925: Performance and predictability”, Journal of Financial Markets 4(1): 1-32.
Goetzmann, W N and R G Ibbotson (2007), “History and the equity risk premium”, in Mehra, R (ed), Handbook of the equity risk premium, p. 515-529, Amsterdam: Elsevier.
Grossman, R S and S Shore (2006), “The cross section of stock returns before World War I”, Journal of Financial and Quantitative Analysis 41(2): 271-294.
Ito, M, A Noda and T Wada (2016), “The evolution of stock market
efficiency in the US: A non-Bayesian time-varying model approach”, Applied Economics 48(7): 621-635.
Le Bris, D, W N Goetzmann and S Pouget (2019), “ The present value
relation over six centuries: The case of the Bazacle company”, Journal of Financial Economics 132(1): 248-265.
Mirowski, P (1987), “What do markets do? Efficiency tests of the 18th-century London stock market”, Explorations in Economic History 24(2): 107-129.
Shiller, R J (1989), Market volatility, Cambridge: MIT Press.
Shiller, R J (2000), Irrational exuberance, Princeton: Princeton University Press.
Smith, W B and A H Cole (1935), Fluctuations in American business, 1790-1860, Cambridge: Cambridge University Press.