October 2004 [HOME] List of illustrations BACK
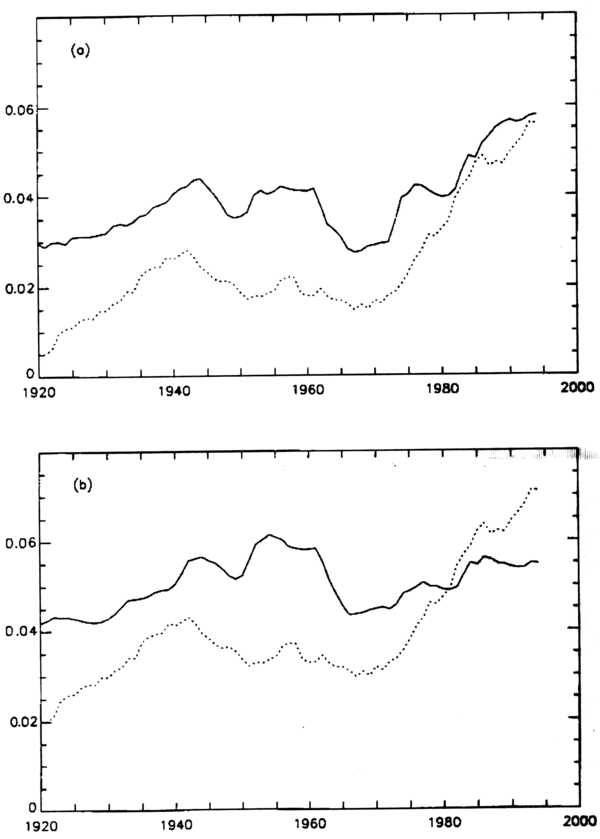
These graphs show evidence, much debated by experts, suggesting that changes in the Sun might have been responsible for some of the main climate fluctuations of the 20th century. (It is harder to see a solar influence on the sharp global temperature rise beginning in the 1970s, which continued after 1995 where the data shown here end.) Dotted curves: mean global temperature. Solid line in upper graph: a speculative estimate of variations of total solar luminosity, reconstructed from old photographs of sunspots and magnetic activity. Solid line in lower graph: a similar speculative reconstruction of variations in ultraviolet radiation. Scientists have wondered whether the long-term solar variations somehow affect climate, but have not found convincing evidence. The variations are a small fraction of the total solar energy — comparable to the change in the energy flow through the Earth's atmosphere caused by a few years of accumulation of greenhouse gases.
Peter Foukal (2002), "A Comparison of Variable Solar Total and Ultraviolet
Irradiance Outputs in the 20th Century," Geophysical
Research Letters 29: 10.1029/2002GL015474.
Copyright © 2002 American Geophysical Union