
Uof Minnesota -
http://www.geo.umn.edu/courses/1001/climate_natural.html
PLATE
TECTONICS
The theory of plate tectonics describes the global scale dynamics of the rigid lithospheric plates as a result of motion in the earth's asthenosphere. These processes significantly influence world climate. (For a thorough discussion of plate tectonics, see Press and Siever, chapter one.) Plate tectonics affects the climate system through three major mechanisms - altering the distribution of continental land masses, changing continental elevations, and affecting variability in atmospheric concentration of carbon dioxide. Please note that the format of the following discussion (to page A-8) is based on Barron (1994).
Configuration of the Continents
The distribution of the continents has changed dramatically over geologic time. For example, just 165 million years ago there was only one super-continent, Pangea (see Press and Siever, page 474-475) and one super-ocean, Panthalassa. Antarctica, today an ice-covered continent with life only at its maritime fringe, hasn't always been centered at the south pole, and extensive coal beds indicate a much more temperate climate in the past. Greenland at one time straddled the equator and the Sahara Desert was at the South Pole. Such drastic differences in the position of continents resulted in equally dramatic differences in global climate throughout earth's 4.6 billion year history.
As described by Barron (1994, p. 6), "In assessing the effects of the distribution of continents on global climate, five major factors must be addressed: differences in surface albedo, land area at high latitudes, the transfer of latent heat, restrictions on ocean currents, and the thermal inertia of continents and oceans."
SURFACE ALBEDO
The amount of energy reflected by a surface is termed albedo. While the average albedo of a tropical ocean is 7%, that of a desert can be almost 25% (Barron, 1994). This difference in the amount of energy reflected away from the earth as opposed to absorbed by the earth's surface strongly influences the total energy budget of the earth. In particular, since the lower latitudes receive a greater amount of incoming solar radiation, than the poleward latitudes, the amount of ocean versus land surface area at low latitudes has a greater affect on the amount of solar energy absorbed or reflected by the earth.
HIGH-LATITUDE LAND AREA
Since incoming solar radiation decreases as latitude increases, snow and ice accumulate more readily on high latitude terrain. This accumulation of snow and ice in turn has a positive feedback effect, for as albedo increases over the white reflective surface (albedo = 65-80%), even more snow and ice are able to accumulate.
TRANSFER OF LATENT HEAT
Latent heat flux refers to the energy needed for a substance, in this case water, to change states (i.e., liquid to vapor). "As water is evaporated from the world's oceans and then returned as precipitation, heat is being removed from the earth's surface and liberated into the atmosphere. This heat energy is ... used to power the earth's weather systems (Duxbury and Duxbury, 1994, p. 121)." For example, evaporation, the preferred mode of heat loss at warm temperatures, is much greater over oceanic regions than over land. Greater oceanic surface area at low latitudes thus results in greater evaporative heat loss.
RESTRICTIONS TO OCEAN CURRENTS
Oceanic circulation is a primary mechanism by which heat is redistributed from equatorial to polar latitudes. Continental barriers to oceanic heat transport restrict the transfer of heat toward the poles, and can influence snow and ice cover. In addition, the distribution of moisture is affected, also influencing climate.
THERMAL INERTIA
The moderating influence of oceans on weather is well-known by coastal residents, and is due to the high thermal inertia of the oceans. While land masses respond quickly to changes in solar input, oceans have a high thermal heat capacity. Solar energy is stored in the summer and released in the winter. This is another way in which the distribution and relative abundance of land and ocean areas can affect climate.
Elevation of the Continents
Collisions between lithospheric plates change the topography of the land. High elevations such as mountain ranges and plateaus can dramatically affect climate by altering patterns of wind circulation, temperature and precipitation.
CHANGING ELEVATION
The most obvious affect of high elevations on climate is the cold temperatures associated with mountains. Atmospheric temperature decreases with height at an approximate rate of 6.5°C per kilometer, termed the "lapse rate" (Barron, 1994). These cold temperatures promote year round snow coverage and hence, high albedo.
GENERAL CIRCULATION
Atmospheric circulation, like oceanic circulation, is driven by excess heat energy at the equator and a deficit at the poles. Given a non rotating earth, air at the equator would warm and rise, while polar air masses would simply cool and sink. As a result of the earth's rotation however, atmospheric circulation is more complex, with three primary cells (polar easterlies, mid latitude westerlies, and equatorial trade winds) in each hemisphere. The precise strength and distribution of these wind belts are strongly influenced by pressure differences across mountain chains.
Mountains and plateaus also play a more direct role in changing atmospheric circulation patterns. As described by Barron (1994, page 8): "The distribution of mountains influences the large-scale circulation of the atmosphere. In the simplest form, this influence is analogous to that of a large rock in a stream. The rock acts as a barrier to the flow of the fluid, and the current pattern is modified around and downstream from the barrier. The positions of the continents and oceans (causing differences in heating) and the distribution of regions of high topography control the position of the large-scale waves in the atmosphere, such as the jet stream, and therefore control the pattern of the weather. A change in topography may well control the distribution of cold air masses or the track of winter storms. Such changes could initiate glaciation in a particular region by promoting even greater cooling, or they could warm high-latitude regions, which may otherwise be cool."
REGIONAL CLIMATE
The windward sides of mountains tend to be much
wetter, while a rain-shadow effect occurs in the lee of mountains. On
the windward side the air is forced upward, cooling with increasing
elevation. Since cooler air can hold less moisture, the cooling air
mass reaches saturation and precipitation occurs. In the lee, deserts
develop because the sinking air warms and therefore the level of
saturation decreases as the air descends. For this reason, the
different sides of mountain belts tend to have very different
climates."
Atmospheric Concentration of Carbon Dioxide
Carbon dioxide in the earth's atmosphere acts as a greenhouse gas, trapping infrared energy re-radiated from the earth's surface, resulting in increased atmospheric temperatures. Increased rates of sea floor spreading, such as those postulated for the warmer Cretaceous period, should be associated with greater outgassing of carbon dioxide through volcanic activity. Increased concentration of atmospheric carbon dioxide could be accommodated by increased silicate weathering, which consumes carbon dioxide. However, increased sea-floor spreading is also associated with high sea level. This process can be illustrated by imagining a cup filled to the brim with water. The addition of mass to the bottom of the cup (new sea floor) results in the overflow of water from the cup. Flooding of continental regions decreases the area available for weathering of silicates - thus, decreasing the likelihood that weathering processes could compensate for increases in carbon dioxide due to increased rates of tectonism.
An example of the influence of plate tectonics on paleoclimate -
A variety of data suggest that the mid
Cretaceous was a warmer interval. These data include high latitude
coal deposits, extended ranges for coral reefs, displaced vegetation
zones, higher sea level and isotopic evidence of increased ocean
temperatures. Specifically, isotopic data suggest that globally
averaged ocean surface temperatures in the Cretaceous were as much as
6-12 °C higher than at present (Barron, 1994). A variety of
factors may have contributed to this warmer climate. The distribution
and relative extent of sea and land masses during the Cretaceous was
an important influence on atmospheric and oceanic circulation
patterns. However, computer models that simulate the Cretaceous
geography only yield a global warming of 4.8 °C instead of the
presumed 6-12 °C change (Barron, 1994). But sea floor spreading
rates in the Cretaceous may have been twice as great as the modern
spreading rate. Increased sea floor spreading would have resulted in
continental flooding and greater outgassing of CO2
to the atmosphere. Models of the Cretaceous climate, assuming a
quadrupled atmospheric carbon dioxide concentration, yield global
warming of 8°C (Barron, 1994), similar to the observed warming of
6-12°C. Improved computer models will help to better identify the
causes of the extreme warmth of the Cretaceous but it is clear from
current models that both the direct effects of plate tectonics on the
land-sea distributions, and its indirect effects on geochemical
processes probably played significant roles.
MILANKOVITCH CYCLES
An important influence of the Earth's climate system comes not from the processes within the Earth, but from Earth's position in space. In the early part of this century, Milutin Milankovitch proposed that periodic variations in the Earth's orbital cycle alters both the amount and distribution of heat that the Earth receives from the Sun, and that this variation causes periodic glacial and interglacial cycles. Although the precise cause of glacial/interglacial cycles is still under debate, the idea of periodic fluctuations in insolation (the amount of solar radiation reaching the Earth's atmosphere) due to orbital changes has been accepted as a major forcing function of climatic change. Milankovitch cycles consist of three components: eccentricity, obliquity, and precession.
Eccentricity
The shape of the Earth's orbit about the sun
varies between circular and slightly elliptical paths (Figure 3). The
result of this eccentricity in the earth's orbit is that the yearly
maximum and minimum distances between the earth and sun varies with a
periodicity of 96,600 years. At times of maximum eccentricity
(maximum elliptical shape), the Sun-Earth distance in the summer
versus winter can enhance seasonality, with warmer summers and colder
winters (Barron, 1994). Variability in total insolation as a function
of eccentricity is less than 1%.
Figure 3. The orbit of the earth changes shape from nearly circular to more elliptical. This is termed eccentricity and is expressed as a percentage (from Barron, 1994, figure 11a).
Obliquity
Obliquity is a measure of the tilt of the Earth's axis from the normal to the plane of its orbit (Barron, 1994) (Figure 4). The tilt varies between 22° to 24.5°, over a period of 41,000 years. Although obliquity does not alter the total amount of heat received at the earth, it does influence the latitudinal distribution of that heat. When the obliquity is a minimum, the polar regions receive the least sunlight (see figure 4) and when it is a maximum, seasonality is enhanced (Barron, 1994).
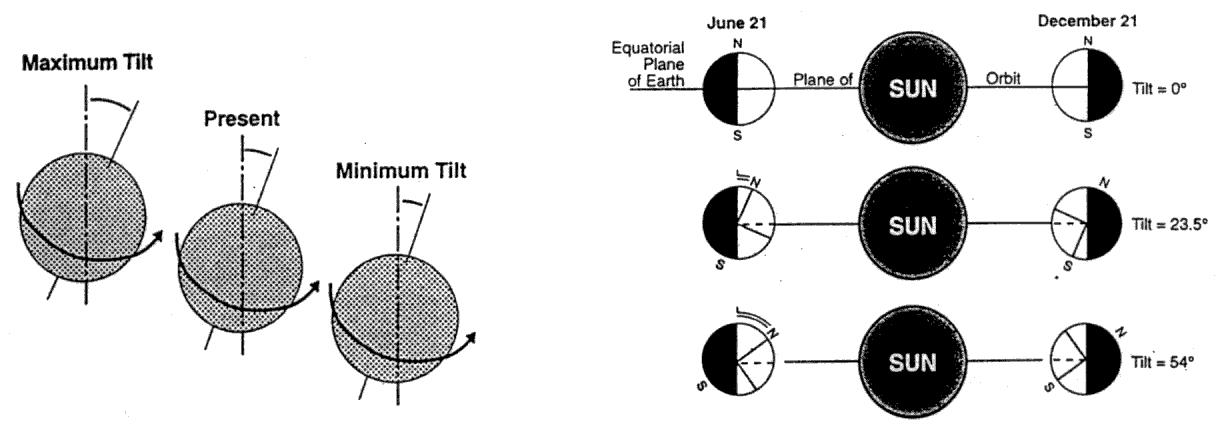
Figure 4. Variation in the tilt of Earth's axis from maximum to minimum, and the effect of axial tilt on the distribution of sunlight. When the tilt is decreased from its present value of 23.5°, the polar regions receive less sunlight; when the tilt is increased, polar regions receive more sunlight (Barron, 1994 figure 11b).
Precession
The Earth is not perfectly round, instead, it has a slight bulge at the equator due to tidal forces. This causes a slight wobble in the Earth's spin, much like that observed in a spinning top. This wobble causes the positions of the equinoxes ( March 20 and September 22; the time when the lengths of day and night are equal) and solstices ( June 21 and December 21; the times when the Sun's distance from the equator is at a maximum) to vary about Earth's orbit. Figure 5 represents this precession of the equinox. The precession of the equinoxes has periods of 19,000 and 23,000 years.

Figure 5. Precession of the equinoxes. Owing to axial precession and to other astronomical movements, the positions of the equinox and solstice shift slowly around Earth's elliptical orbit, and complete one full cycle about every 22,000 years. Eleven thousand years ago, the winter solstice occurred near one end of the orbit. Today, the winter solstice occurs near the opposite end of the orbit (Barron, 1994, figure 11c).
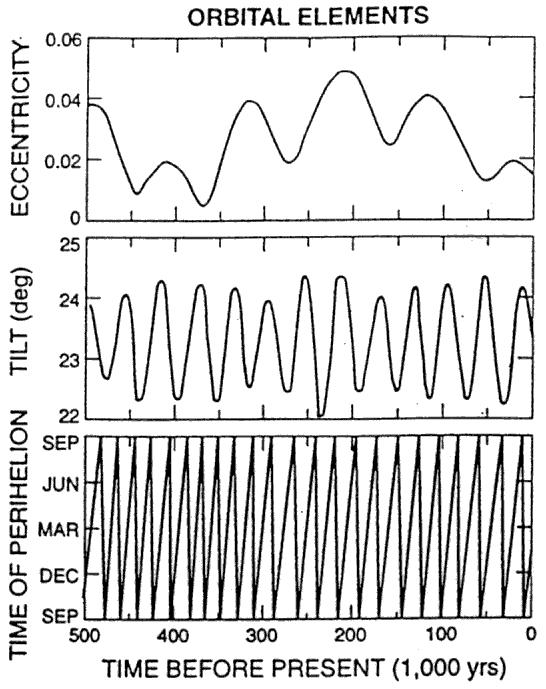
Figure 6. Variations in Earth's orbital elements, eccentricity, tilt (obliquity), and time of perihelion (precession of the equinoxes) computed for the last 500,000 years with a computer program written by Tamara Ledley and Starley Thompson (Barron, 1994, figure 12).
Although eccentricity, tilt, and precession only produce minor changes in the Earth's total insolation, they greatly affect its local distribution and timing (seasonal cycle). Figure 7 illustrates the variability in insolation in the Northern Hemisphere over the past 500,000 years as a result of Milankovitch forcing. These changes can have a pronounced affect on the climate system.

Figure 7. Variations in insolation (in watts per square meter) determined from the variation in Earth's orbital elements (Barron, 1994, figure 13).
An example of astronomical cycles recorded by proxy data
Much scientific investigation has concentrated on whether Milankovitch cycles act as the "pacemaker of the ice ages." A primary source of data is recovered from the calcareous shells of microscopic marine organisms. When these organisms precipitate their shells they preserve a record of the oxygen isotopic composition of the ocean water in which they grew. The oxygen isotopic composition of the ocean, in turn, reflects a combination of processes, including seawater temperature and the volume of seawater stored on land as glacial ice. During evaporation, water containing the lighter isotope of oxygen (16O), is preferentially evaporated, so precipitation is enriched in 16O. During glacial intervals, more 16O is locked up as ice on land, and the oceans become enriched in 18O. Thus the oxygen isotopic composition of calcareous organisms recovered from marine sediment cores serves as a proxy record of seawater chemistry, ocean temperature, and glacial ice volume. The record illustrated in figure 8 reveals the rhythmic nature of glaciation over the past 700,000 years. Remarkably enough, this rhythm occurs at intervals of 19,000, 24,000, 43,000, and 100,000 years.

Figure 8. Oxygen isotopic record for the last 700,000 years illustrating glacial/interglacial cycles (after Emiliani, 1978). The isotopic measurements were performed on the calcareous skeletons of marine zooplankton. Higher numbers indicate interglacial periods. Note the troughs are approximately 100,000 years apart (Barron, 1994, figure 10).
The story, of course, is not quite so simple.
So far, we have been unable to determine the physical tie between
changes in insolation and glaciation that would explain the observed
statistical relationship between astronomical cycles and glacial
data. The relatively small changes in insolation do not, by
themselves, appear to be capable of causing continental glaciation.
Either they act as a trigger mechanism, or are magnified by other
processes to produce glaciation. In addition, some feedbacks may
produce cyclic behavior even if the causative factors were not
periodic. At this point, our computer models are too simplistic, and
are not capable of modeling all the positive and negative feedbacks
involved.
VOLCANOES
The ability of volcanic eruptions to alter landscapes and cause devastation is well known, but volcanoes can also cause significant changes in climate. They do this by increasing the amount of silicate-dust particles (produced from the fragmentation of quenched magma to volcanic ash) and sulfuric-acid aerosols (derived from the conversion of volcanic sulfur dioxide gas to sulfuric acid liquid particles) in the atmosphere. The injection of sulfuric acid aerosols to the stratosphere, in particular can cause significant short-term changes in global climatic.
These aerosols, when injected into the stratosphere (upper atmosphere, between ~11-50 km altitude), absorb and backscatter incoming solar radiation, and absorb outgoing infrared radiation emitted from the Earth. While this absorption of radiation increases stratospheric temperatures, these aerosols also block the incoming solar radiation, creating a concomitant cooling in the lower atmosphere. Studies have shown that volcanic emissions from massive eruptions can reduce global surface temperatures by several degrees Celsius for a few years. For example, Sigurdsson (1990) suggests that an eruption emitting 1012 kg of sulfuric acid could cool surface temperatures by 3-4 °C. However, this volume of aerosols is significantly larger than any known historically recent eruption.
Different types of volcanoes produce different aerosols. Basaltic fissure eruptions (for example 'spreading center' eruptions like those in Iceland) have a higher sulfur yield and can therefore affect climate to a greater degree than silicate-rich eruptions, like those of island arcs (Mouginis-Mark et al., 1993) Therefore, not only do volcanoes in general need to be considered in climate change studies, but also their tectonic setting and magma chemistry (Mouginis-Mark et al., 1993). An example of this is seen by comparing two volcanic eruptions of similar size: the Mount St. Helens eruption of 1980 and the Mexican El Chichon eruption of 1982. Both eruptions ejected relatively small amounts of magma (0.3 to 0.4 km3 ) but the El Chichon eruption was significantly more sulfur rich. The Mount St. Helens eruption produced no significant climatic changes, while the El Chichon eruption exploded about 20 Mt of sulfuric acid into the stratosphere, lowering surface temperatures in the Northern Hemisphere by a few tenths of a degree Celsius for about one year (Rampino, Self, and Stothers, 1988).
Recognition of the climatic changes associated with volcanic eruptions can be traced back to 1783, when Benjamin Franklin observed the "dry fog" in Europe following the Laki Fissure eruption in Iceland. In fact, historical records are quite useful to re-write the history of the effects of past eruptions on past climates. Records that describe prolonged darkness, cold summers and colder winters, failed crops, and famine, all indicate post-eruption conditions. After the 1883 Krakatoa eruption, observations of atmospheric optical phenomenon were made, including blurring of celestial objects, an odd bluish color of the sun, and extreme sunrises and sunsets (Rampino, Self and Stothers, 1988).
Examples of climate change due to past volcanic eruptions
Perhaps one of the best known climatic alterations due to a volcanic eruption is the year 1816; the "year without a summer" following the 1815 Tambora eruption on Sumbawa Island in Indonesia. Tambora is one of the largest known eruptions in the past 10,000 years (Rampino, Self, and Stothers, 1988). It produced ash fallout over a 4x10⁵ km2 area and caused darkness for about 2 days as far away as 600 km from the volcano. Studies including tree ring observations, indicate that the 1816 summer was approximately 1.5 °C cooler than the summer of 1815. The year following the eruption was one of hardship felt across the globe. The summer was cold and wet in western Europe, crops failed, people starved, disease spread and social unrest grew (Rampino, Self, and Stothers, 1988).
The volcanic eruption noted by Benjamin
Franklin, the Icelandic Laki fissure eruption of 1783, was a very
unusual event. The eruption began in June and lasted for about eight
months. The eruptions were not continuously violent, instead they
were a lava-flow type (Rampino, Self, and Stothers, 1988). The fog
that Franklin described was seen as far away as Asia and North
Africa. Although this was a less violent eruption, its effects were
drastic. In Iceland, crops failed, 75% of the livestock died, and 1/4
of the Icelandic people died due to starvation and disease. The
winter following the eruption was the coldest in 225 years.
SOLAR ACTIVITY
Variations in the Earth's orbit about the sun (Milankovitch cycles) were previously, discussed as one external factor in climatic change. But the Sun itself is another external forcing function on the climate system. As Sun activity varies, the Earth experiences variations in the amount of energy it receives.
Solar activity varies slightly, causing changes in the output of solar radiation and hence the amount of solar energy reaching the Earth's outer atmosphere. When solar activity is high, the solar wind deflects the cosmic rays that produce the cosmogenic isotopes 14 C and 10Be. Therefore, times of high solar activity result in decreased amounts of cosmogenic isotopes reaching the Earth's surface. Historical variations in solar activity can be measured from 14C and 10Be isotopes found in tree rings and ice cores respectively. Solar variability also can be estimated through records of sunspot counts. Sunspots are dark, cool areas on the Sun, abundant when the Sun is active. Sunspots appear to have an 11 year cycle, with a sunspot number minimum occurring every 11 years (the exact length of the cycle depends upon the solar activity, high activity yields shorter cycles).
Variations in solar activity have the potential to affect the temperature of the Earth. Current experiments with computer models indicate that a 4 °C change in surface temperatures would follow a 2% change in the solar constant (Rind and Overpeck, 1993). Plots of smoothed sunspot cycle length and Northern Hemisphere temperature anomalies between 1861 and 1989 display an excellent correlation, although a specific cause and effect relationship has not been determined (Friis-Christensen and Lassen, 1991).
An example of the influence of solar variability on paleoclimate
The Little Ice Age was a time between the 13 th to 19th centuries during which many parts of the globe recorded global cooling. Glaciers expanded, crops failed, rivers such as the Thames in London froze over, and colonies in Greenland died out due to the increasingly harsh climate. The Little Ice Age is an exciting event to study because it occurred recently enough that many diverse sources of data yield climate information, including dates of harvests, fishing catch records, and paintings of advancing mountain glaciers. Geological data are also available from the time of the Little Ice Age, from polar and high altitude ice cores, tree rings, deep-sea sediments, and corals. The ability to compare and contrast the historical and geological data for the Little Ice Age makes this climatic event one of the most fruitful for developing an understanding of our system of proxy data. The actual "cause" of the Little Ice Age is still under debate. However, it does correspond in time to the Maunder Minimum, a period of decreased solar activity. Estimates of the magnitude of cooling during the Little Ice Age are from 0.5 °C to 1.5 °C (Rind and Overpeck, 1993), while models of the Maunder Minimum insolation reduction of 0.25% only yield a 0.45 °C temperature drop. Therefore, if the estimates of temperature for the Little Ice Age are assumed correct, the Maunder Minimum was not acting alone as a forcing function. Other proposed contributing forcing functions include increased volcanic aerosols such as those from the Tambora eruption of 1815, and changes in the ocean's heat transport circulation patterns.
Go back to:
Continue on to:
3- HUMAN IMPACTS ON THE CLIMATE SYSTEM